
Convincing probe-rs to Work with VexRiscv
Over the last few years, Rust tooling for embedded development has become quite good. Specifically, the probe-rs and defmt (with RTT) projects address common needs like downloading firmware, running tests in-situ, logging with minimal overhead, and catching crashes. ARM-based microcontrollers, such as the STM32 family, are well supported nowadays. RISC-V support is still expanding, but the basics are all there.
I’d like to take advantage of these embedded Rust tools while developing firmware on a VexRiscv FPGA soft core. So, in this post I’ll show how I convinced probe-rs to play nice with my JTAG adapter, connect over a JTAG tunnel, and run from RAM without breaking defmt-rtt logs.
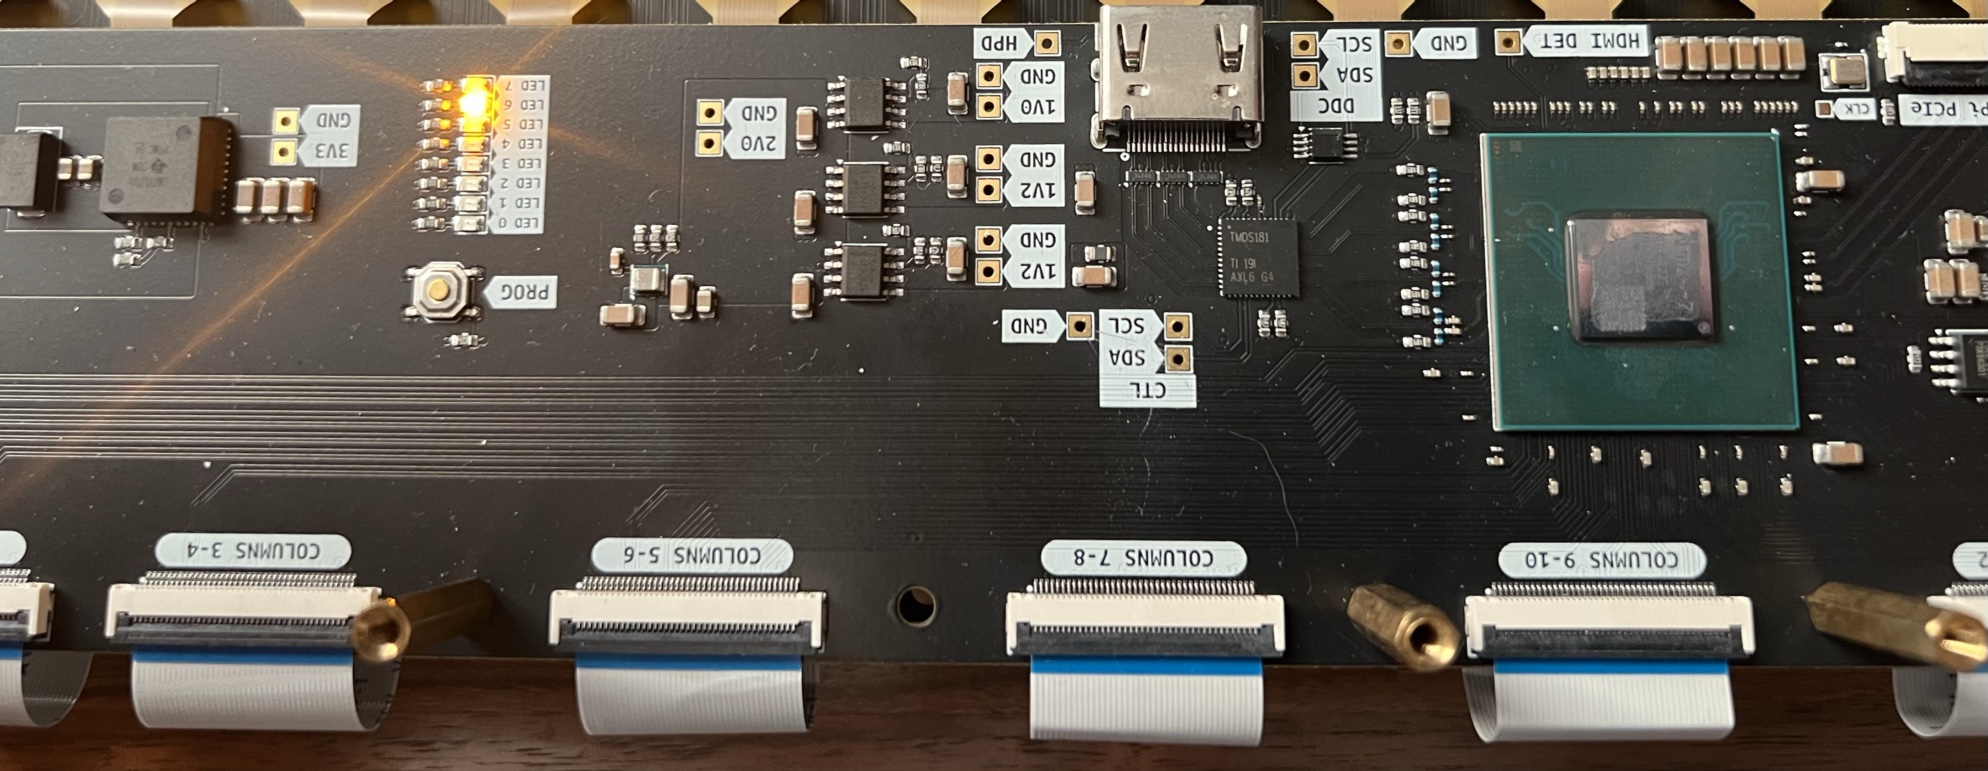 VexRiscv soft core blinking some LEDs connected to a Xilinx XC7A200T FPGA for a new project
Where the problems started
Installing probe-rs is pretty easy with Cargo (the docs show all kinds of other methods too).
cargo install probe-rs-tools --locked

# For the latest dev version (master branch), including the updates
# mentioned in this post, you'll need to use this command:
# cargo install probe-rs-tools --git https://github.com/probe-rs/probe-rs --locked
Checking if a JTAG adapter is detected is also pretty easy:
▶ probe-rs list
The following debug probes were found:
[0]: Digilent USB Device -- 0403:6014:210299A1FC59 (FTDI)
Let’s see if it detects any targets:
▶ probe-rs info --protocol=jtag
Probing target via JTAG

Error identifying target using protocol JTAG: An error with the usage of the probe occurred
Well, that’s not too promising. The JTAG adapter is definitely connected, and OpenOCD uses it just fine. Let’s see if the logs give any clues.
▶ RUST_LOG=probe_rs=debug probe-rs info --protocol=jtag
# lots of irrelevant logs ...
DEBUG probe_rs::probe::ftdi::ftdaye: scanning 1 interfaces
DEBUG probe_rs::probe::ftdi::ftdaye: Interface is #0
DEBUG probe_rs::probe::ftdi::ftdaye: Opened FTDI device: Some(FT232H)
# lots of irrelevant logs ...
DEBUG probe_rs::probe::common: DR: BitVec<u8, bitvec::order::Lsb0> { addr: 0x55de2d416f40, head: 000, bits: 256, capacity: 256 } [1, 1, 1, 1, 1, 1, 1, 1, 1, 1, 1, 1, 1, 1, 1, 1, 1, 1, 1, 1, 1, 1, 1, 1, 1, 1, 1, 1, 1, 1, 1, 1, 1, 1, 1, 1, 1, 1, 1, 1, 1, 1, 1, 1, 1, 1, 1, 1, 1, 1, 1, 1, 1, 1, 1, 1, 1, 1, 1, 1, 1, 1, 1, 1, 1, 1, 1, 1, 1, 1, 1, 1, 1, 1, 1, 1, 1, 1, 1, 1, 1, 1, 1, 1, 1, 1, 1, 1, 1, 1, 1, 1, 1, 1, 1, 1, 1, 1, 1, 1, 1, 1, 1, 1, 1, 1, 1, 1, 1, 1, 1, 1, 1, 1, 1, 1, 1, 1, 1, 1, 1, 1, 1, 1, 1, 1, 1, 1, 1, 1, 1, 1, 1, 1, 1, 1, 1, 1, 1, 1, 1, 1, 1, 1, 1, 1, 1, 1, 1, 1, 1, 1, 1, 1, 1, 1, 1, 1, 1, 1, 1, 1, 1, 1, 1, 1, 1, 1, 1, 1, 1, 1, 1, 1, 1, 1, 1, 1, 1, 1, 1, 1, 1, 1, 1, 1, 1, 1, 1, 1, 1, 1, 1, 1, 1, 1, 1, 1, 1, 1, 1, 1, 1, 1, 1, 1, 1, 1, 1, 1, 1, 1, 1, 1, 1, 1, 1, 1, 1, 1, 1, 1, 1, 1, 1, 1, 1, 1, 1, 1, 1, 1, 1, 1, 1, 1, 1, 1, 1, 1, 1, 1, 1, 1, 1, 1, 1, 1, 1, 1, 1, 1, 1, 1, 1, 1]
 INFO probe_rs::probe::common: JTAG DR scan complete, found 0 TAPs. []
DEBUG probe_rs::probe::common: Scanning JTAG chain for IR lengths
DEBUG probe_rs::probe::common: Write IR: [], len=0
Error identifying target using protocol JTAG: An error with the usage of the probe occurred
So, it looks like my Digilent HS3 JTAG adapter is detected as an FTDI probe (FT232H) – that seems correct. However, when probe-rs tries to find TAPs on the scan-chain, the bits come back all ones – no TAPs to be seen. OpenOCD finds the Xilinx TAP just fine, what’s going on?
A clue from OpenOCD
After a lot of head-scratching and re-running OpenOCD to test my sanity, I’ve found a clue. OpenOCD uses TCL scripts to configure different adapters, and all of OpenOCD’s scripts for FTDI adapters have lines like this:
# From digilent_jtag_hs3.cfg
ftdi vid_pid 0x0403 0x6014
ftdi device_desc "Digilent USB Device"

# This looks interesting:
ftdi layout_init 0x2088 0x308b
I wonder how probe-rs configures the layout. Digging into the source:
# in probe-rs/src/probe/ftdi/mod.rs
pub fn attach(&mut self) -> Result<(), FtdiError> {
    // ...
    // TMS starts high
    let output = 0x0008;

    // TMS, TDO and TCK are outputs
    let direction = 0x000b;

    self.device.set_pins(output, direction)?;

    // ...
}
Huh. Those values don’t match what OpenOCD uses. Or, at least it seems like set_pins and OpenOCD’s ftdi layout_init must do similar things. What if I hard-code the values from OpenOCD just to test?
# in probe-rs/src/probe/ftdi/mod.rs
pub fn attach(&mut self) -> Result<(), FtdiError> {
    // ...

    self.device.set_pins(0x2088, 0x308b)?;

    // ...
}
▶ RUST_LOG=probe_rs=debug cargo run --release -p probe-rs-tools -- info --protocol=jtag
    Compiling probe-rs v0.24.0 (/home/craigjb/Projects/probe-rs/probe-rs)
    Compiling probe-rs-tools v0.24.0 (/home/craigjb/Projects/probe-rs/probe-rs-tools)
     Finished `release` profile [optimized] target(s) in 24.45s
    Running `target/release/probe-rs info`

Probing target via JTAG

# ...

Found IDCODE: 0x13636093 (Xilinx)
 INFO probe_rs::probe::common: JTAG DR scan complete, found 1 TAPs. [Some(IdCode { .0: 325279891, version: 1, part_number: 13878, manufacturer: 73, ma
nufacturer_continuation: 0, manufacturer_identity: 73, lsbit: true })]
DEBUG probe_rs::probe::common: Scanning JTAG chain for IR lengths

# ...

DEBUG probe_rs::probe::common: IR scan: [1, 0, 1, 0, 1, 0, 0, 0, 0, 0, 0, 0, 0, 0, 1, 1]
DEBUG probe_rs::probe::common: IR scan: [1, 0, 1, 0, 1, 0]
 INFO probe_rs::probe::common: Only one TAP detected, IR length 6
 INFO probe_rs::probe::common: Found 1 TAPs on reset scan
DEBUG probe_rs::probe::common: Detected IR lens: [6]
DEBUG probe_rs::probe::common: Selecting JTAG TAP: 0
DEBUG probe_rs::probe::common: Setting chain params: ChainParams { irpre: 0, irpost: 0, drpre: 0, drpost: 0, irlen: 6 }
DEBUG probe_rs::probe::common: Setting max_ir_address to 63

# Irrelevant errors about not finding an ARM chip

RISC-V Chip:
  IDCODE: 00000005ce
    Version:      0
    Part:         0
    Manufacturer: 743 (Spansion Inc)
Xtensa Chip:
  IDCODE: 0000000000
    Version:      0
    Part:         0
    Manufacturer: 0 (Unknown Manufacturer Code)
Hey, that looks better! probe-rs received some intelligble data, found one TAP, and even identified the chip as a Xilinx part. It’s time to see if I can patch probe-rs. Turns out, the Digilent JTAG adapters (HS1, HS2, and HS3) are not uniquely identifiable from just USB vendor ID (vid) and product ID (pid). So, the FTDI module actually needs to use the product string to figure out what pin layout to use.
The fix for Digilent probes
PR #2793 was merged into probe-rs on September 2nd, so if you install from git, these Digilent probes will now work!
cargo install probe-rs-tools --git https://github.com/probe-rs/probe-rs --locked
JTAG tunneling with probe-rs
In the previous post, I showed how a JTAG tunnel allows using the same cable to configure an FPGA and debug a soft core. OpenOCD supports this via the riscv use_bscan_tunnel command. For probe-rs, this took quite a bit of work since I had to implement the JTAG tunnel capability. PR #2794 was merged on September 5th, so if you install from git it will work now!
Connecting to the VexRiscv target requires a new chip definition YAML file (plenty of examples in the targets folder). You’ll see that I add some new fields to the schema for JTAG tunneling.
name: VexRiscv
variants:
- name: VexRiscv
  cores:
  - name: core0
    type: riscv
    core_access_options: !Riscv
  jtag:
    riscv_tunnel: # Access via JTAG tunnel
      ir_id: 0x23 # Xilinx BSCANE2 (userid=4)
      ir_width: 6
  memory_map:
  - !Ram
    range:
      start: 0x00000000
      end: 0x00004000
    cores:
    - core0
When running with probe-rs, it needs the chip name and definition file path. It’s easier to put this in a cargo config so we can just type cargo run --release or cargo rr with a handy alias. For embedded devices, the flash or RAM constraints are often quite tight, so running in release mode is typical.
# .cargo/config.toml
[target.riscv32i-unknown-none-elf]
rustflags = [
  "-C", "link-arg=-Tdevice.x",
  "-C", "link-arg=-Tlink.x",
  "-C", "link-arg=-Tdefmt.x",
  "-C", "link-arg=--nmagic",
]
runner = 'probe-rs run --chip-description-path vexriscv.yaml --chip=vexriscv'

[build]
target = "riscv32i-unknown-none-elf"

[alias]
rr = "run --release"
br = "build --release"
▶ cargo rr
   Compiling slabware v0.1.0 (/home/craigjb/Projects/Slabware/fw/slabware)
    Finished `release` profile [optimized + debuginfo] target(s) in 0.01s
   Running `probe-rs run --chip-description-path vexriscv.yaml --chip=vexriscv target/riscv32i-unknown-none-elf/release/slabware`
    Finished in 0.90373385s
It runs and LEDs blink! Something’s missing though… I included several defmt log statements (using defmt-rtt), but nothing showed up.
Brief defmt-rtt intro
In previous decades, logging from an embedded CPU was quite an involved affair. You could expose a UART header on the board, hookup a UART-to-USB dongle, and compile in some string formatting. This required bringing up a UART driver, creating some buffering scheme, and setting up interrupts or DMA so logging won’t block everything. Or, you could use semihosting with many ARM microcontrollers, which allowed calls to the debugging host (like an OS syscall over JTAG). However, semihosting also blocks execution of the firmware, since it works via a CPU exception (supervisor call). The debugging host must read the data synchronously and resume execution. Another method, Segger Real Time Transfer (RTT) achieves better throughput without blocking by setting up ring buffers in the microcontroller’s RAM. Then the debugging host asynchronously monitors these buffers without blocking execution. It’s an improvement, but RTT still requires formatting log messages on the embedded CPU itself – and string formatting code can be quite large, stealing precious kilobytes of flash or RAM!
That’s where Knurling-rs’s defmt project comes in. The basic idea is to defer formatting (hence the name) to the host. So, the microcontroller writes a format string and the raw arguments (e.g. a 32-bit integer), but doesn’t do the formatting itself. Code to write this raw data is quite small. Then the debugging host uses the larger standard library functions to actually format the string with provided arguments and print it. When combined with RTT, defmt let’s us log without blocking and avoid bloating code size with string formatting routines. Clever!
And, it’s easy to use. For example:
// main.rs
#![no_std]
#![no_main]

use defmt_rtt as _;
use panic_halt as _;
use riscv_rt::entry;

#[entry]
fn main() -> ! {
    defmt::println!("print from VexRiscv!");
    defmt::info!("info from VexRiscv!");
    defmt::warn!("warn from VexRiscv!");
    defmt::error!("error from VexRiscv!");
    defmt::debug!("debug from VexRiscv!");
    defmt::trace!("trace from VexRiscv!");

    let some_number: u32 = 0xDEADBEEF;
    defmt::error!("The cow is not well: {:#X}", some_number);

    loop {}
}
My header was cut off
Now, back to the problem at hand: why don’t I see any output from these defmt log statements? Re-running with logging enabled in probe-rs showed something a little strange:
▶ RUST_LOG=probe_rs::rtt=debug cargo rr
    Finished in 0.9123262s
DEBUG probe_rs::rtt: Scanning at exact address: 0x00000bfc
DEBUG probe_rs::rtt: Scanning at exact address: 0x00000bfc
DEBUG probe_rs::rtt: Scanning at exact address: 0x00000bfc
DEBUG probe_rs::rtt: Scanning at exact address: 0x00000bfc
DEBUG probe_rs::rtt: Scanning at exact address: 0x00000bfc
DEBUG probe_rs::rtt: Scanning at exact address: 0x00000bfc
DEBUG probe_rs::rtt: Scanning at exact address: 0x00000bfc
DEBUG probe_rs::rtt: Scanning at exact address: 0x00000bfc
# continues repeating
It looks like probe-rs can’t find the RTT header block in RAM. What if we take a look at that address:
▶ probe-rs debug --chip vexriscv --chip-description-path vexriscv.yaml
>> halt
Core stopped at address 0x00000378
>> read8 0x00000bfc 10
0x00000bfc = 0x00
0x00000bfd = 0x00
0x00000bfe = 0x00
0x00000bff = 0x00
0x00000c00 = 0x00
0x00000c01 = 0x00
0x00000c02 = 0x00
0x00000c03 = 0x00
0x00000c04 = 0x00
0x00000c05 = 0x00
The memory location that’s supposed to have a RTT header is blank! The control block is supposed to start with a magic string "SEGGER RTT", but this shows all zeros.
What if I try just RTT, without defmt, to see if that works? This requires a different crate, rtt-target.
// main.rs
#![no_std]
#![no_main]

use panic_halt as _;
use riscv_rt::entry;
use rtt_target::{rtt_init_print, rprintln};

#[entry]
fn main() -> ! {
    rtt_init_print!();

    rprintln!("print from VexRiscv!");

    loop {}
}
Yup, that works! So does that mean something is wrong with defmt? Not so fast.
At this point, a closer look into the defmt-rtt source gives a big clue to what’s happening. See in the above code, rtt_target initializes the header in RAM when we call rtt_init_print!. However, defmt-rtt defines the header as static data (snippet below). That’s pretty cool, since it doesn’t require any code size overhead to setup RTT. The header is just statically output into the .data segment in RAM.
# defmt-rtt/src/lib.rs
static mut _SEGGER_RTT: Header = Header {
    id: *b"SEGGER RTT\0\0\0\0\0\0",
    max_up_channels: 1,
    max_down_channels: 0,
    up_channel: Channel {
        name: &NAME as *const _ as *const u8,
        #[allow(static_mut_refs)]
        buffer: unsafe { &mut BUFFER as *mut _ as *mut u8 },
        size: BUF_SIZE,
        write: AtomicUsize::new(0),
        read: AtomicUsize::new(0),
        flags: AtomicUsize::new(MODE_NON_BLOCKING_TRIM),
    },
};
Can we check if the header is getting downloaded? With a couple other probe-rs commands, of course!
▶ probe-rs download --chip-description-path vexriscv.yaml --chip=vexriscv target/riscv32i-unknown-none-elf/release/slabware
    Finished in 0.91375744s
▶ probe-rs debug --chip vexriscv --chip-description-path vexriscv.yaml
>> read8 0x00000bfc 10
0x00000bfc = 0x53
0x00000bfd = 0x45
0x00000bfe = 0x47
0x00000bff = 0x47
0x00000c00 = 0x45
0x00000c01 = 0x52
0x00000c02 = 0x20
0x00000c03 = 0x52
0x00000c04 = 0x54
0x00000c05 = 0x54
That’s a correct looking RTT header! Notice the big difference in what we did though: probe-rs download doesn’t start execution nor does it start an RTT client. So, this points to something in probe-rs run zeroing out the header.
And wouldn’t you know it, there’s function clear_control_block thats’s called by the run command:
# probe-rs/probe-rs-tools/src/bin/probe-rs/cmd/run/mod.rs
if run_download {
    // We ended up resetting the MCU, throw away old RTT data and prevent
    // printing warnings when it initialises.
    let mut core = session.core(core_id)?;
    rtt_client.clear_control_block(&mut core)?;
}
At first this doesn’t make any sense. However, if we think about a typical microcontroller executing from flash, it’d go like this:
- probe-rs downloads firmware to flash
- probe-rs resets & halts the CPU
- probe-rs clears the RTT control block (by calling
clear_control_block) - probe-rs resumes CPU execution
- CPU runs startup code from flash that copies .data segment to RAM
In this typical case, any header in RAM would just be left over from a previous run. So it makes sense to clear it out. However, when downloading to and running from RAM, #5 doesn’t happen. There is no flash to copy from. The header is cleared permanently.
Another probe-rs pull request
PR #2795 was merged into probe-rs on September 5th. So if you install from git, this issue is resolved now.
With the change, probe-rs cheks whether the RTT control block address is within the downloaded memory ranges. If the address is written during download, it’s not cleared. The typical case with flash is not affected, since the expected RTT control block address is in RAM.
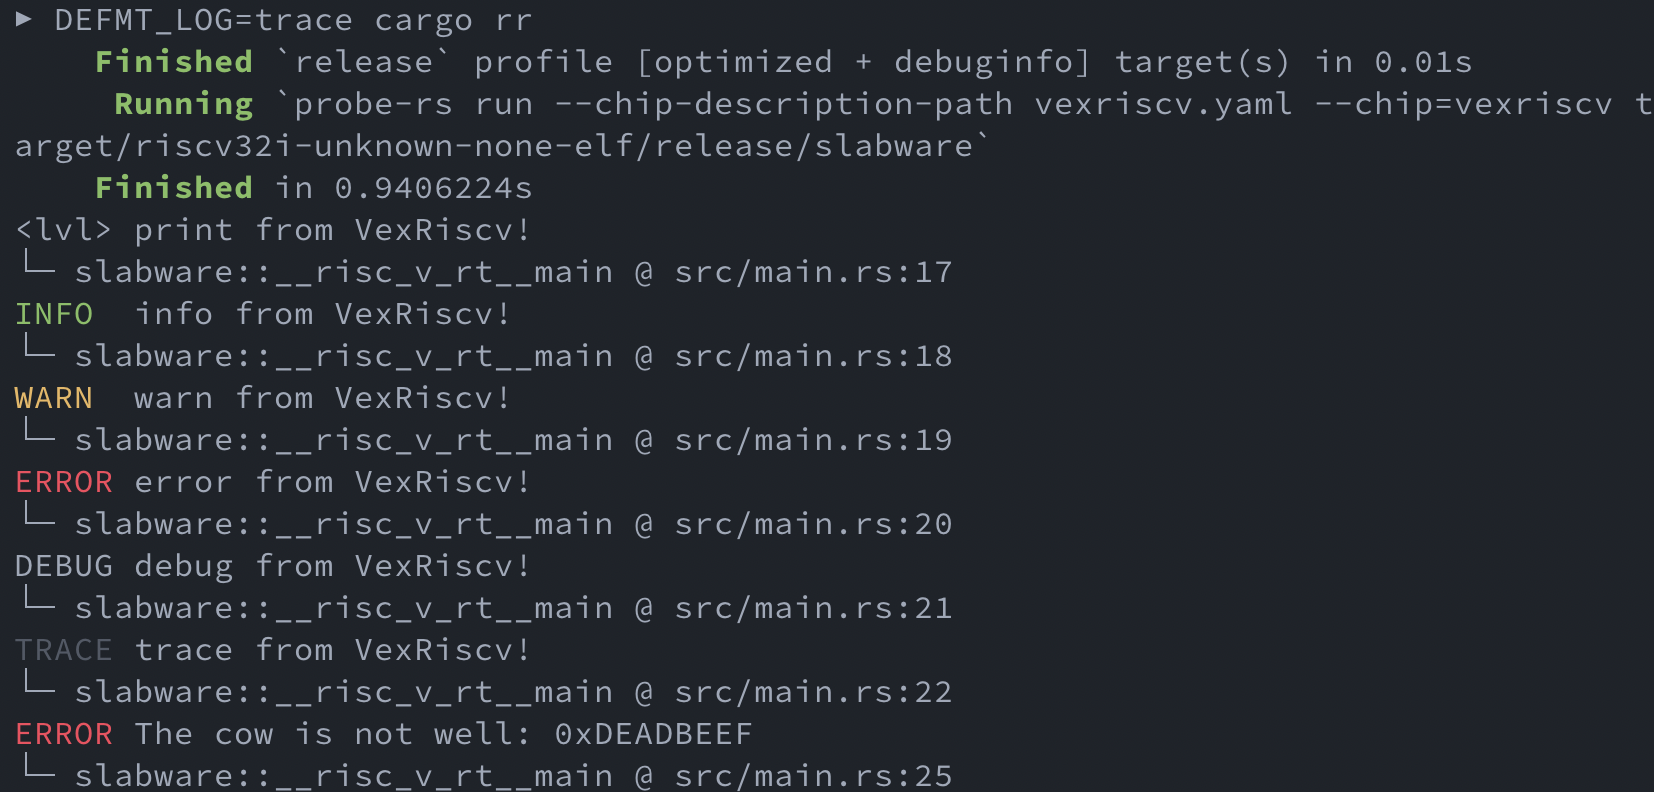
And, here’s the original defmt-rtt example running now. Look at those beautiful color-coded logs with function names and line numbers for reference!
Code
The example firmware code is available on this branch on GitHub.
The SpinalHDL gateware that defines the VexRiscv CPU, RAM, and peripherals is available here.